A Signal May Only Warn if It Is Rare
A RAM warning fired on 84 percent of all session starts with zero OOM events. The fix was never the threshold, it was measuring the right quantity.
TL;DR
For four months my session start warned on almost every run. Measured across 1,477 session starts in 18 repos: any of the three host-resource warnings fired on 99.0 percent of starts, the RAM warning alone on 84.0 percent. The same window holds 4,884 finished sessions with zero OOM markers and zero ENOSPC, meaning not a single run died because memory ran out or a disk filled up. The cause was never the threshold, it was the quantity being measured. On macOS, os.freemem() reports free pages only, and their median sits at 0.4 GB even on machines with 128 GB. Turning the dial on a warning like that repairs nothing. Three commands are enough to see the defect on your own machine in twenty seconds.
What a Warning Actually Has to Do
A host-resource warning exists to change a decision. Shrink a wave. Sequence a second session. Stop before the machine freezes. If none of those decisions comes out differently, the warning was noise. That is why the rule now sitting in my ruleset is worded bluntly: a warning that fires on almost every session changes nothing except how fast the operator learns to ignore it.
The same holds for any dashboard whose red tile has been red for months.
One number follows from that, and the number is the real payoff. Once a warning class crosses roughly 10 percent fire rate, the instrument is broken, not the world. Then you re-aim the instrument. You do not obey it, and you do not silence it either. Both feel like progress and neither is: obeying means giving up capacity you actually have, silencing means taping over the hole and losing the next real warning along with it.
The opposite direction is just as suspect. A class sitting at 0 percent across a few hundred samples is either genuinely rare or silently broken, and from the outside the two look identical. That is the reason I store fire rates at all instead of only verdicts.
The Measurement That Exposed the Alarm
The gate had a real trigger. On 2026-04-19 my work machine froze across eight parallel sessions, plus two OOM aborts inside worktrees. So the gate was not invented out of boredom, it was the reaction to a day when the machine died under my hands.
Four months later I counted. 1,477 session.started events across 18 repos, window from 2026-04-19 to 2026-08-21, evaluated on 2026-08-21. The fire rates:
ram_free_gb < 2: 84.0 percentclaude_processes >= 5: 93.6 percentcpu_load_pct > 80: 15.6 percent- any of the three: 99.0 percent
The counter-check comes from the same data: 4,884 finished sessions in that window, zero OOM markers, zero ENOSPC. A gate that warns on 99 out of 100 starts while its catastrophe never happens across 4,884 cases is not an early-warning system. It is wallpaper.
Six repos had, independently of each other, written the false alarm into their own learnings, one of them with confidence 1.0. The knowledge was there. It was just never aggregated anywhere, which is why nobody was forced into a correction for four months.
Why os.freemem() Measures the Wrong Thing on a Mac
The defect sits one layer below the threshold. On Darwin, os.freemem() returns free pages and nothing else. Inactive pages, speculative pages and purgeable cache do not count, even though the operating system hands them over at any moment. Across hosts between 24 and 128 GB the median of that number is 0.4 GB. A threshold of 2 GB does not stand a chance against it.
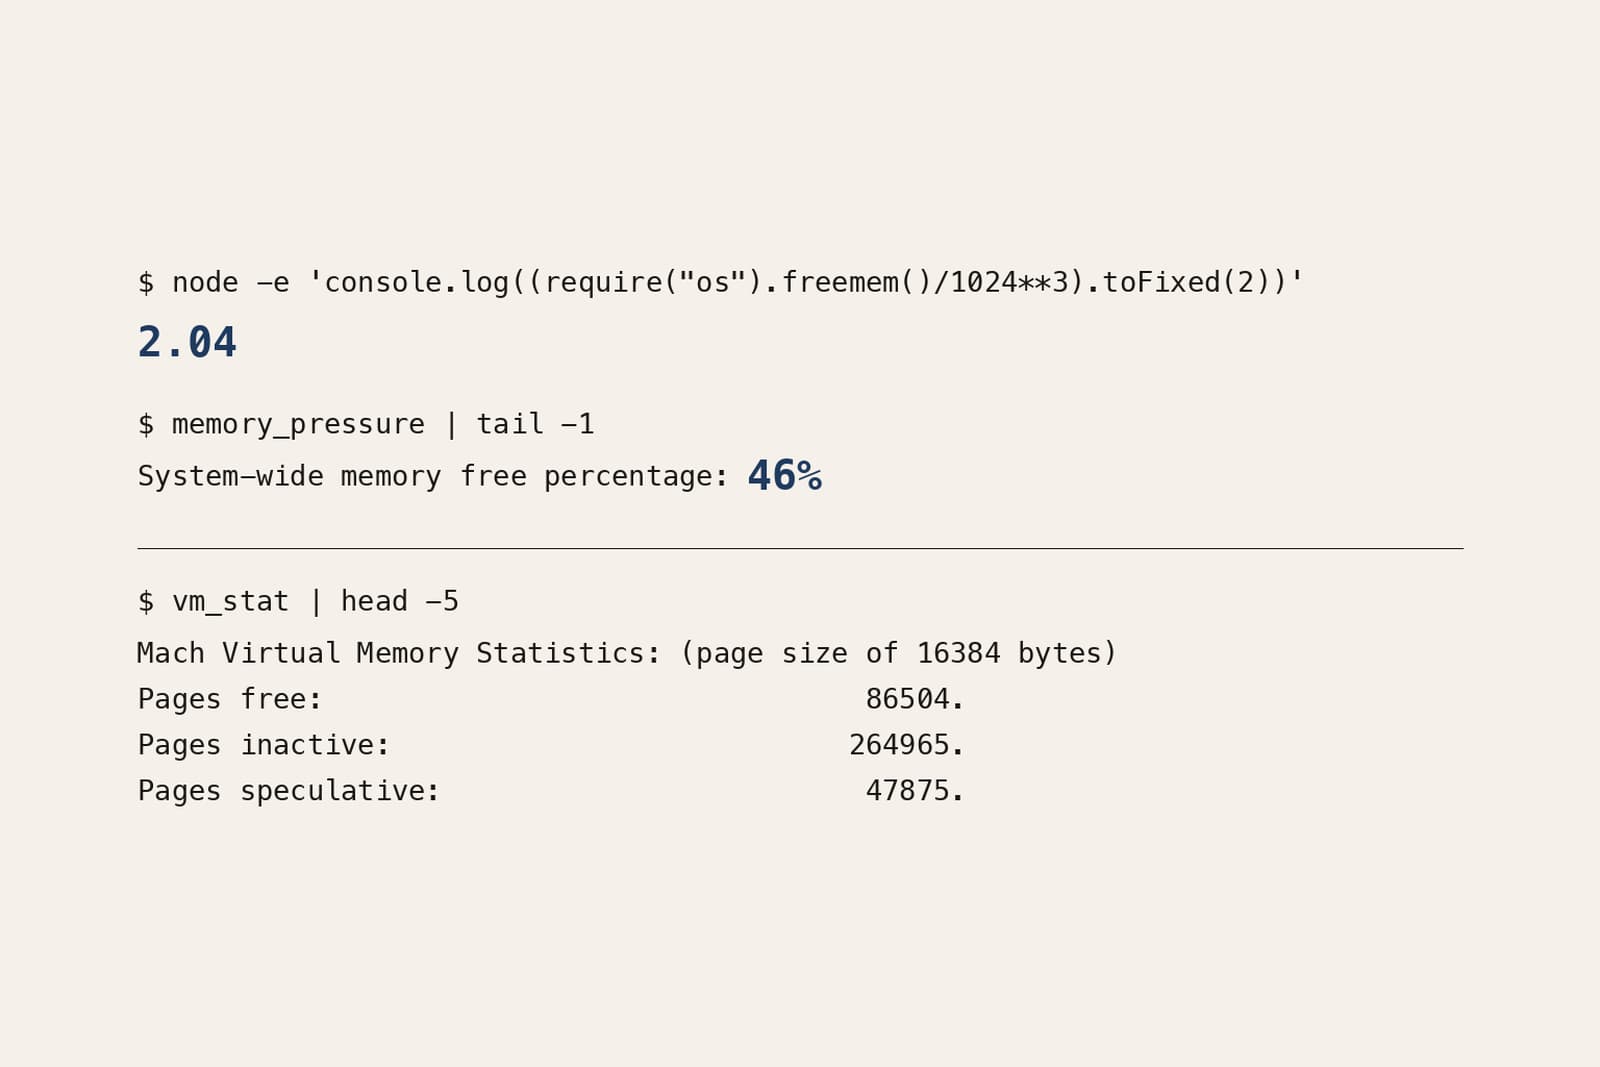
You can reproduce this in three lines. Today, on my work machine with 24 GB:
node -e 'console.log((require("os").freemem()/1024**3).toFixed(2))'
# 2.04

memory_pressure | tail -1
# System-wide memory free percentage: 46%

vm_stat | head -5
# Pagesize 16384, Pages free 86504, Pages inactive 264965, Pages speculative 47875
2.04 GB supposedly free on 24 GB, against 46 percent free according to the operating system. That is the entire defect in two lines, and the third line explains it: inactive and speculative pages together are a multiple of the free ones. Run this on your own machine before trusting any memory heuristic built on freemem.
The correction was accordingly not a new number but an order of precedence. First the percentage from memory_pressure, then a computed availability from vm_stat, and only if both are missing, the free pages. Availability is the sum of free, inactive, speculative and purgeable pages times the page size. File-backed cache is deliberately left out, because under pressure it does not come back for free. On Linux and Windows os.freemem() reports the right thing, which is why it stays the fallback there instead of being removed outright.
A signal may only warn if it is rare.
The Half Fix That Left the Hole Open
The first version of the correction was not wrong, only too polite. It suppressed the free-RAM warning exactly when memory pressure was healthy, pinned to a constant of 30 percent free pressure. Sounds reasonable. The band below it, however, stayed on free pages: as soon as there was any pressure at all, the decision fell back to the number that is systematically off on this operating system. In precisely the range where the decision matters, the instrument was still broken.
A better signal replaces a worse one, it does not merely suppress it. Suppression is a patch, precedence is the fix. The distinction sounds academic, but it is the difference between a rule you reopen half a year later and one that holds.
One Signal Is Not Enough, and Not Every Signal May Count
The second half of the repair concerns how signals combine. Today a verdict only triggers when either one hard signal fires or two independent soft ones fire together. Two observations from the data drove that.
First, a process count does not measure what it looks like it measures. The ratio of Claude processes to actually running sessions has a median of 6.0, measured across 1,461 paired samples. So a threshold of five processes is roughly one session. The same number with the right unit, peer_sessions >= 5, fires on 4.2 percent instead of 93.6. Check the unit before you argue about the threshold, not afterwards.
Second, not every signal qualifies as a second opinion. Zombie processes from aborted runs are a permanent state on my machine: 6, 13 and 9 across three measurements minutes apart. Counting them does not buy a second independent signal, it buys the same noise twice. How I catch that permanent state separately is in A Menu Bar App Kills My Zombie Processes. CPU load is no lone decider either: one spike fell from 96 to 75 percent within 36 seconds. In simulation, cpu > 90 AND peers >= 3 fires on 2.2 percent, and peers >= 4 alone on 7.4 percent. Both sit under my 10 percent line, the combination comfortably so.
Swap is no horror story either. One reference host carried 6.9 GB of used swap at 35 percent free pressure, without any thrashing at all. Swap is a tool of the operating system, not a distress call.
A third state came out of this as well. When a probe is unreadable, that is not green. Previously an unreadable value silently degraded to harmless, so a broken gauge looked exactly like a healthy machine. Today unreadable has its own state with its own reason, drawn from a frozen enum so the reasons cannot dissolve back into free text.
Two smaller findings round it off, and both are more embarrassing than the actual bug. The verdict reached the session history for only 15 of 1,734 sessions, which is 0.9 percent. For four months my own rule was effectively unfalsifiable, because the data needed to falsify it was never stored. And the banner I actually see at startup had five emitters and four lines, exactly one of which was displayed. Whatever number drives the verdict is the number the operator has to see. That kind of wiring gap is a pattern I now hunt for on purpose, not a one-off, as I laid out once before in Building an Agent Fleet: Sven, BuilderBob and the Loop.
What I Take Away From This
- A warning class above roughly 10 percent is a broken instrument. The environment is not too loud, the measurement is aimed wrong. And a class at exactly 0 percent deserves the same suspicion.
- A better signal replaces a worse one. Suppression is a patch, precedence is the fix. A half fix that only covers the healthy range leaves open exactly the range where decisions get made.
- Check the unit before the threshold. Processes are not sessions, factor 6.0 at the median. The same number in the right unit dropped from 93.6 to 4.2 percent.
- If you do not store the fire rate, you cannot falsify your own rule. 0.9 percent persisted verdicts means four months of blind trust in a heuristic.
- Unreadable is not green. A broken gauge needs a state of its own, otherwise it disguises itself as good news.
Conclusion
The smallest honest number in this story is 0.4 GB. That is what macOS reports as free at the median, whether 24 or 128 GB are installed, and that number carried four months of false alarms. It is unspectacular, it appears in no release note, and it explained more than every threshold debate before it.
If you build gates that are supposed to throttle your own agents: count the fire rate before you turn a dial. One counter per warning class is enough. What the surrounding procedure looks like, the one these gates live in, is in How session-orchestrator Matured in 9 Days. What I work with otherwise is under tooling, and how I go about it under way of working.